This is Part II in a series of posts. I recommend the reader start with Part I first, which has some necessary background information that will enhance and clarify what we’re covering here.
Shortly after Project Año got underway, I received a most interesting message from someone I’ll call D.P.:
The problem with such esoteric endeavors? Outside of a stock chart and some technical tools, they are very rarely actionable. Very interesting though, I will give it that.
As an MBA who purposefully gave up the current monetary paradigm a few years back, I do admit to being rather embarrassed when reading this remark. As I was fumbling through all the dream data I’ve been collecting over the months, all I could think was, “How in the world did I not think of this myself?”
Although I was extremely skeptical, I found myself cheerfully pulling various data sets and getting them prepared for a comparison run on “real world” stats, such as the DJIA. Occasionally my skeptical mind would question my actions, “Why am I wasting such an enormous amount of time?”
The First Mirror
I think this was run number 6 or 7 (yes, ONLY the 6th or 7th run). The earlier runs went as expected….no correlation between dreams and the stock markets whatsoever. When looking at this next graph, at first my mind saw total opposites and my initial impression was to toss it into the recycle bin. But wait…Opposites?
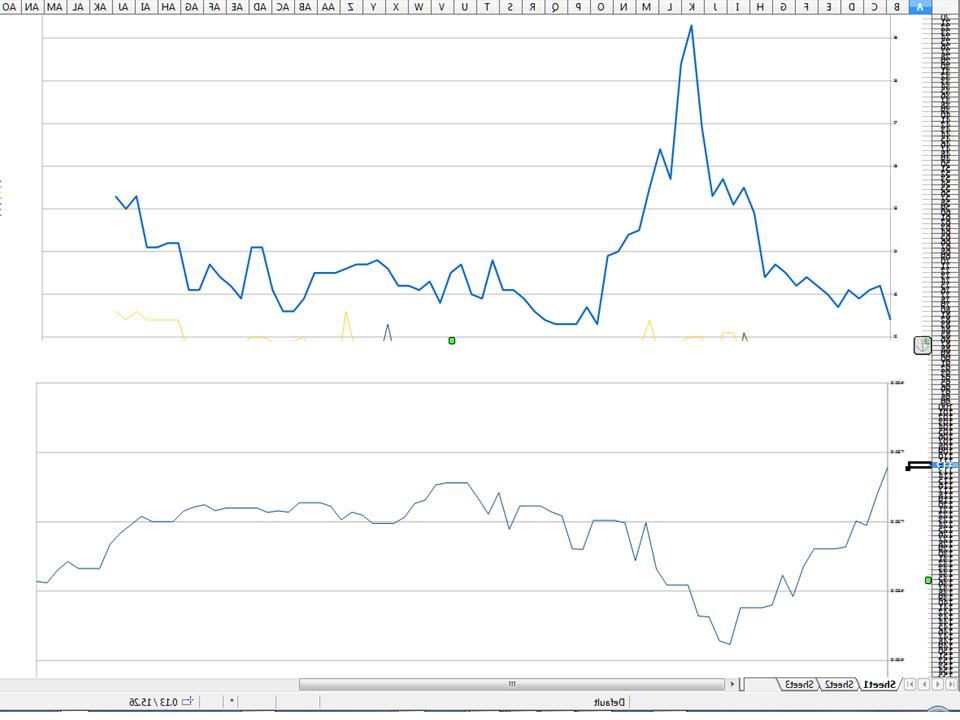
What are we looking at here? In the above chart, the bottom line just happens to be the DJIA, and my dream run #7 is the top line. Not only are they just about a nearly perfect mirror image, but the dream run actually PRECEDES the DJIA! In other words, when the dream line shoots up, it does so just days prior the DJIA going down.
It’s an inverse relationship, calculated to have a -0.57 correlation value. Considering these are just raw numbers, I was rather impressed.
If I’m losing you to technical jargon, just realize what this means: Peoples’ dreams unknowingly tell us when the financial markets are going to go up and down! This isn’t just one or two people being told in their dreams about the markets. Rather, this is the NDC collecting regular amounts of dream data from the DreamBase, and collectively we can tell what the markets will do! This is rather unbelievable, but just wait, it gets better.
First, though, let me say this again, just so everyone is clear…this is NOT one or two individuals who are being told in their dream where the DJIA will be going in a day or two. Rather, these are big trends that come from seemingly unrelated symbols and metaphors that people dream! These symbols just happen to correlate with the DJIA. Truly remarkable, yes?!
However, -0.57 correlation is okay to start with, but we don’t want to be touting something this great with such a low number. Granted, with 0.57 or -0.57, one could actually have a winning trading strategy, but no one wants to use a model with that low of probabilities.
So I went back to work…
The Exciting Work Begins
Before long, I was seeing a particular pattern and was able to gradually work my way up to some very impressive correlation values. In this next chart, I used some techniques to smooth out the violent ups and down as well as figure out an equation to get the two lines as close as possible. This is the result (blue line = DJIA & green line = Dreams):
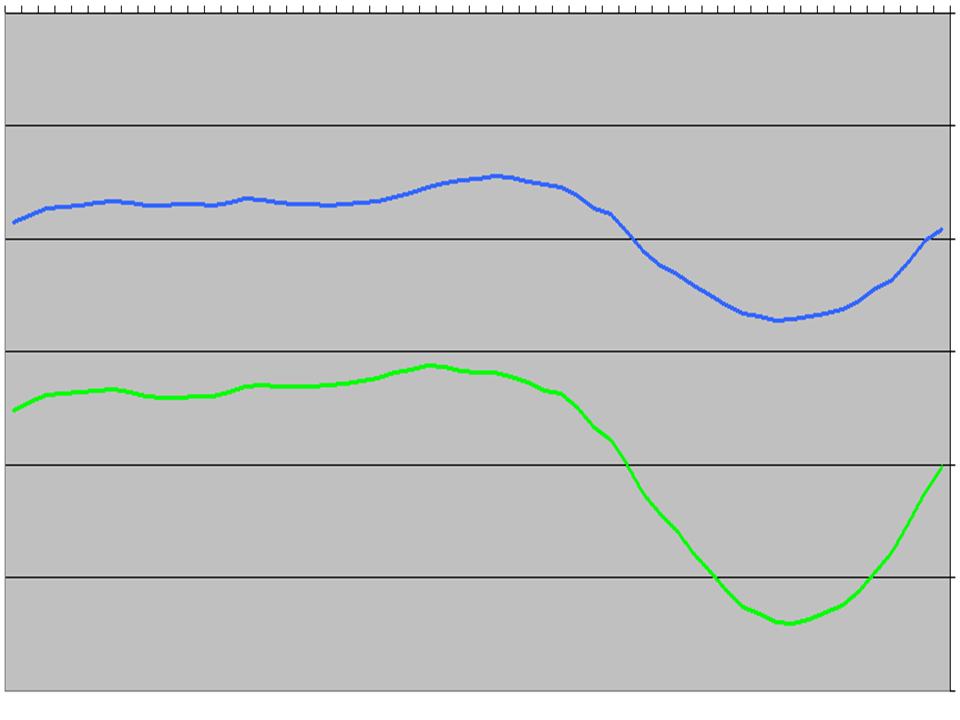
Not bad, huh? These lines above are now correlated almost perfectly with a correlation ratio of 0.95 compared to a max possible correlation of 1.0 (in other words, the highest the correlation scale will go is 1.0, and these lines that I mathematically generated are very close to the perfect score).
You probably now notice that the lines themselves have no time delay…they are basically rising and falling simultaneously, and this is because the equation between the two lines holds the time difference. In other words, when the green line plays out (i.e., when the dream data comes in for the day), the equation will tell us WHEN the blue line will do the same thing in the future.
The only problem with the awesome stats above is that the way this model is designed makes it very difficult to employ. Explaining the reason why this is so would be much too technical, so just suffice it to say that there is a balance that must be met here: On the one hand, we need accuracy and a tight correlation factor, but on the other hand, we need it to be an easy transition from nice looking graphs to something useful, especially since we want to really prove that dreams are not only correlated with real world events, but I now propose that reality actually begins with dreams after I’m seeing this absolutely stunning correlation with “reality.”
Of course, is the Dow-Jones Industrial Average really, in fact, “reality?” I doubt it, but let’s move on.
Major Geeking Headaches
With days and days of geeking it out with more math than I could ever hope to digest, my compromise was found, except I didn’t have just one model…I now have about 15 of them! Here are a couple of them:
1. Dream data (green line) vs DJIA (red line) 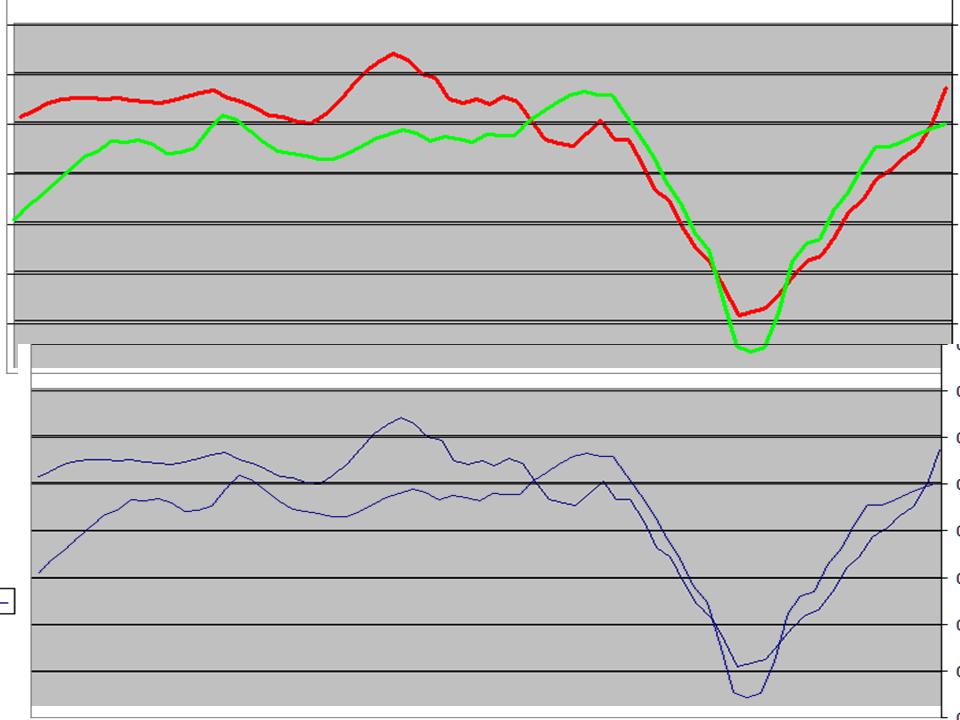
2. Dream-based algorithms (blue and yellow lines) vs DJIA (red line)
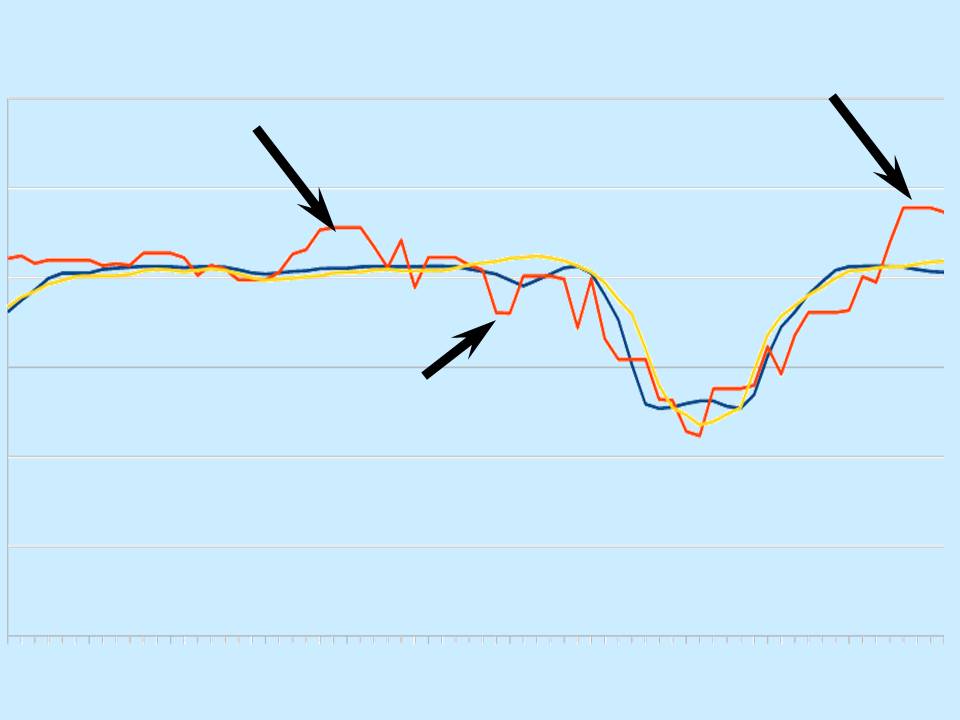
The second chart here has the least correlation between dream data and the DJIA (at 0.83 out a max possible 1.00), but this is also the most agile and ready to employ at a moment’s notice. I indicated the problem areas with this model by pointing arrows to the deficiencies. But here’s the deal…notice how even though the DJIA (the red line) ventures from both of my other algorithms, it always seems to snap right back to the predicted lines (within a couple of days).
What’s more, is that this last model predicts actual, raw DJIA closing numbers based only on collected dream data. There is no financial analysis whatsoever. There is no subjectively listening to the talking heads ramble on and on about nothing. There is no reading any balance sheets or figuring out where gold and oil are going. Just look at a line and see where the DJIA will eventually go.
The Rubber Meets the Road
So here we have it…one of the most accurate predictive models for where the DJIA will go, so someone is making a lot of money right now, right?
Even though this model accurately predicted the DJIA between August and Nov 1st (about 2.5 months), no money should be allocated in the real markets without at least about 6 months worth of data, especially seeing how the markets are in completely uncharted territory right now (which is something that has me laughing to no end… seeing how disconnected Wall St is from the REAL WORLD.)
We don’t have any idea whether the model has any validity as the market makes yet another move higher today. The dreams supported this move, but are the equations still valid? And even if they are valid, are they still maximized? That’s the bigger question.
So what happens if the dreams no longer correlate at all with the DJIA from here on out? All this would mean is that no one will make any money on the equations that were developed, but make no mistake: The period between August and November WILL go down in history as absolute proof that dreams can be mathematically associated with real world events.
At a minimum, I’m 99.9% confident that the next stock market crash will be seen about 3-7 days prior through the eyes of objective, quantitative, dream data.
Plus, there are all sorts of ethical issues generated by this revelation. Cayce repeatedly warned through his own experiences about garnering selfish gain by way of esoteric applications. As we gain more data exposure and refine the equations even more, we’ll address these issues directly.
Going Forward: The US Dream Index™
There will be more articles associated with this in days to come. In the meantime, we will have discussions in the Forum about what I now call, “The US Dream Index™”
The public discussion will be on-going in this forum: http://nationaldreamcenter.com/forum18/forumdisplay.php?fid=32
The primary audience for the most in-depth discussions and daily predictions/tests will be all Paradigm 3 participants, and that forum is here: http://nationaldreamcenter.com/forum18/forumdisplay.php?fid=31 Not only have these people given their time and energy to the Paradigm 3 project (to which they shall be directly rewarded), but the Dream Average itself is directly applicable to what Paradigm 3 is all about (particularly the P1 aspect, as we refuse to meddle in determining market ups and downs by way of the P2 team.)
But going forward, you can bet your bottom dollar that we’ll be exploring other quantitative areas of life. Perhaps we can predict the number of DUI deaths or the number of births in any given month. Who knows…maybe the winning horse in every horse race is already known by some strange combination of dream symbols. The DJIA is just the beginning of what looks like a promising field…and a field that doesn’t even yet have a name.
So why don’t we do that now…
Quantitative Precogontology™
…is a name not yet taken. Quantitative is obvious…we’re using numbers and discreet data to show a relationship. Then, Precog- has to do with seeing future events, while –Ontology deals with the study of knowing. So in essence, we’re using numbers to know the future before it arrives.
Sound interesting? Join the dedicated forum thread for the bigger-picture, future-looking, scientific study right here: http://nationaldreamcenter.com/forum18/showthread.php?tid=338
Okay, so to summarize Part II, basically we may have stumbled upon THE most accurate predictor of stock market movements. If the future proves this hypothesis wrong, then the Fall of 2014 will go down in history as proof that dreams CAN, in fact, quantitatively predict future events. The correlations data, R-squared numbers, and confidence numbers all suggest that is is one spectacular find, and with the new Quantitative Precogontology, we’ll be looking for more of these correlations. Stay tuned and get involved!
Our first question from a reader is as follows:
Chris, This is fascinating, yet begs the question: is this only going to be shared with those Paradigm 3 participants or do you plan on stating the possibilities to the public in advance of changes in order for others to witness the accuracy. Very Respectfully, MG.
Answer: http://nationaldreamcenter.com/forum18/showthread.php?tid=338&pid=2255#pid2255