Note: If you’d like to see all the headlines that were generated during Project August, they are all listed here, including links to substantiate those that were entirely or partially fulfilled: http://nationaldreamcenter.com/wp/projects/project-august/reports-and-predictions/proj-aug-headlines/
Its one thing to marvel at all the amazing predictions that came true over the summer, but even more important is to investigate the data that was cooking while we were all dreaming.
Instead of pushing out a 30-page report all at once, I thought it would be better to trickle out a little bit of analysis each day. Today, we’ll look at accuracy of a prediction and compare that to WHEN it ultimately comes true.
There are several stats that will be of great interest to our dreamers, but perhaps none as magnificent as this one we’ll talk about today. The data here indicates that the longer it takes the prediction to manifest, the less accuracy it tends to display.
In order to come to this conclusion, we sorted all the data in accordance with how long it took for the headline to come true (in terms of the number of weeks). Then we calculated an average score for each week. For example, the average score of all the hits that occurred within one week of the source date, was about 4.6 points out of 5.0. (The “source” would either be a dream or a linguistics phrase…whichever was used to construct the predictive headline).
We correlated the number of weeks until manifestation to the average level of predictive accuracy. The level of accuracy was indicated by the average DreamSeer score.
The correlation coefficient between the number of weeks to manifestation and the average predictive accuracy was -0.43038, which means that with almost a moderate level of correlation, the longer the prediction takes to come true, the less accurate it tends to be. 0.5 to 0.7 is generally considered to be a moderate level of correlation, but not significantly strong.
Therefore, we can say that there is definitely a trend here, but 0.43 indicates a low to moderate level of correlation.
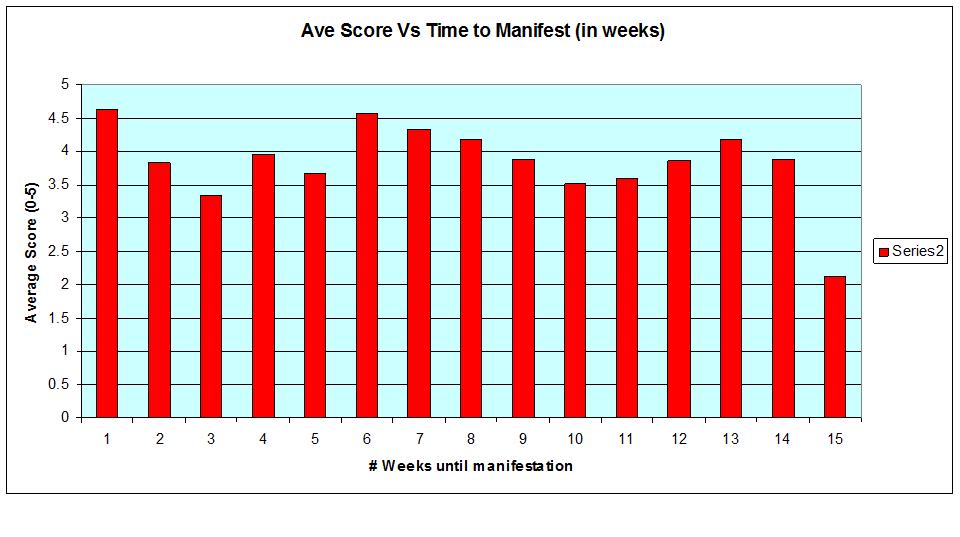
A visual representation can greatly help here. Referencing Figure 1, a “wave of accuracy” becomes apparent. The highest average score seems to take place in the first week after source event takes places (i.e., the dream or the linguistics).
According to Project August results, the accuracy begins falling off quickly after the first week. Average accuracy was 4.6 in the first week, but if it came true in the second week, the average score falls to roughly 3.8 and then down to about 3.3 by the third week.
The peaks in the waves appear to have taken place at 1 week, 6 weeks, and 13 weeks, although those peaks are decreasing slightly all the while.
Figure 1: Time to Manifest vs Accuracy
Implications
The correlation data and Figure 1 could be a critical concept for future operations, especially Paradigm 3. The data suggests that to achieve better accuracy, we must act very quickly in order to maximize accuracy of the prediction.
Success in Paradigm 3 absolutely requires accuracy. In order to max out our creative potential for the future, we need to know exactly where humanity is headed. If we know where it’s going, we tip it with minimum effort in a slightly new direction.
It also means that as time drones on without manifestation of the prediction, that we will need to “refresh” our predictions through incubating more dreams on the subject material. Iterative dreaming is something we didn’t accomplish for Proj Aug, but it will be a mainstay in Paradigm 3.
Summary
– Low to medium correlation between the time it takes to manifest vs. the level of accuracy of the prediction. They are negatively correlated, meaning the longer the time to manifestation, the lower the accuracy.
– Highest accuracy is afforded for events that manifest within one week of the prediction’s source event.
– If it takes multiple weeks to manifest a prediction, consider updating the details with iterative dreaming (return to the prediction and incubate more information about the coming event.
– Since accuracy over time seems to go up and down in a wave-like pattern, it is wise to time the incubations for those expected valleys, such as 3 weeks and 10 weeks.
Leave A Comment