If it’s been looking pretty quiet here lately, I’ve done a great job at keeping the tremendous activity hidden. There are so many exciting things going on here I can hardly keep a lid on my enthusiasm. But I will, because I must….at least for another couple of weeks.
Over the holidays I got a chance to really sit down and get comfortable while cracking open the bot algorithms to see where things could improve. Even though this isn’t the only thing I got a chance to do, DreamBot4 is where we begin for December because this will look quite a bit different and the new data that we’re supplying should be a whole lot more meaningful to both future oriented predictions and historical record keeping.
A couple of months ago, I stopped including surge amounts in the data runs because I stumbled upon a new sorting algorithm that I wanted keep under wraps, if you will. Under this new sorting plan, I was seeing how certain data was trending with specific words that later came true. In other words, the old way to doing business would have separated two key words, but 8 times out of 10, those words would come true. Therefore, I sorted the list differently in order to maximize the times when those types of words printed out side by side.
I know that might sound confusing, but in essence I’m hoping the algorithm stays consistent, because the types of words that are appearing next to each are seemingly more relevant than what we saw from the previous sorting. Okay, enough of this gibberish, let’s just get to the point already!
The Goal of DreamBot4
Every day, the DreamBot bounces around the internet reading dreams. When it comes back, it knows what dream words are hot and which ones aren’t. As far as predicting the future, we already know that big surging dream words can and do predict future events, particularly when those words cannot be explained by past events (aka “day residue.”) Thus, the main purpose of the daily DreamBot4 is to identify big memes prior to them appearing in our outer reality.
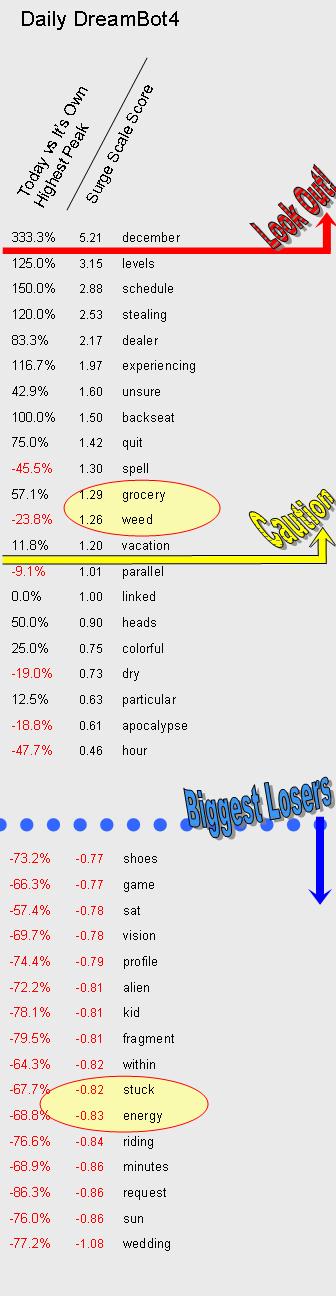
In order to fully explain the new face of DreamBot4, I’ll supply today’s DreamBot run and we can go through it step by step so that readers can understand how to read the new layout.
Three Columns
Whereas the old sorting had simply one straight column of words, there was no associated data to give those words meaning. For example, big deal if DOG shows up somewhere in the list. I need to know at least something about where DOG has been in the past (in terms of dream frequency) and how popular it is now before I get all excited about seeing a headline about it. Better yet, how is DOG doing compared to all the other words? These sorts of things are at least partially answered in the two left columns of the new daily chart.
The first column (far left) indicates where the word sits according to its all-time high. The middle column is a number that represents how much surge each word is carrying in the dreams. It’s called the Surge Score, and represents an aggregate of a few important indicators about each dream word.
The whole list itself is sorted by the Surge Score (middle column), and I’ll talk more about what that means in a second.
The top half of the daily run is comprised of dream words that are accelerating in frequency. All the words towards the top are showing up in more and more dreams lately. However, there is also a new section toward the bottom that shows the words moving in the opposite direction (i.e. lower frequency counts). This section represents words that people are dreaming much LESS about lately.
3 Main Groups
We now have major groupings that will be a part of each run. At the top of the chart, you’ll see a red line and arrow labeled, “Look Out!” The red line and arrow will slide down to include any words that would have typically met the main criteria for a Red Alert. I actually started naming that red line “Red Alert,” but there will be times when big surging words will not meet ALL the criteria for Red Alert. So, we simply call it “Look Out” for the words above the red arrow. Should any of those words meet the full Red Alert criteria, it will have the traditional star next to it to denote Red Alert.
In this case, the only word above the red line is “December.” As explained in today’s DreamBot run, December surge is completely explainable because people are now inputing dreams on December 1st. Therefore, we acknowledge that December is surging, but it will not be a Red Alert.
Note that not every run will have words above the red arrow, and if that is the case, that just means that nothing surged to a substantial amount to warrant that status. Let it be known that there is not yet any NEW definitive criteria for whether a word meets the Red Alert criteria or not. Anything that looks close I basically have to convert the score to our previous scale to determine if it’s a high flying meme or not. In time, though, we’ll begin to have enough data where our new scale will be sufficient for calling the shots. Until then it appears that our new scale score of about 5 to 7 will be the minimum amount for a “Look Out” or “Red Alert.”
The next category down the chart is the yellow arrow called “Caution.” These words are definitely something to keep an eye on because enough dreamers are pushing that word above where it normally is (and where it was). Very generally, a surge score of about 1.0 will warrant a “Caution,” particularly because generally a 1.0 roughly means that the word is at least twice as high today as it was yesterday.
The last positive section is considered “Iffy.” Either the word is too far down from it’s all time high, it’s historical average, or it’s simply not surging high enough, but if there’s room, we’ll put a few of those in the run because of the opportunity to develop linguistics phrases.
The lowest grouping on our new chart is the blue arrow called Biggest Losers. Just as the higher surging words are jumping up today from yesterday, the Biggest Losers are plummeting in frequency from yesterday (and front its all-time peak). We list these here because it’s our new supposition that any MAJOR MOVES (regardless of whether it’s positive or negative) marks something important for real-world application. Of course, we have zero data to back up this hypothesis, but based on what we have seen so far, it does look promising. The only challenge is whether the interpretation changes based on a decreasing/plummeting word versus an increasing word. That remains to be seen.
What is the Surge Score?
The surge score is automated based on a logical array of critical data about the word’s historical usage. The biggest factor is the level of frequency in the collective dreams as compared between yesterday’s hits and today’s number of hits. The percentage change starts the mathematical equation. Also included is the location of where the word is compared to it’s all-time high and it’s all-time average.
Ultimately, the score measures how much the word is surging, but the main difference from the surge amount in previous months is that we can now identify words that are SLOWLY surging, which is something that eluded us before. Incidentally, this is why several big words never made our bot runs because they were surging too slowly (over a matter of days or weeks rather than in a single day.) That problem has been solved, but now the scale is completely relative. In other words, the number by itself is almost meaningless until we get more data to which to compare it. However, as long as we have other words in the run, we always have something to which to compare, which is what gives it context and meaning.
How do you use the first column?
The first column seems to be more critical to prediction making than does the all-time average. For example, if you see 200% compared to the average, what if that is still a mere 25% of it’s all-time high? 200% might sound important, but it’s almost meaningless without knowing whether it’s really at an unusually high level or not. Therefore, the first column is rather important.
INSIGHT #1: Any positive number in column #1 means that this word is at an all time high. The higher the number, the higher the word is compared to its previous peak.
For example, find “Backseat” in this run. Since it has 100% in column #1, that means it currently has exactly double the amount of hits today in the collective dreams as compared to the highest number of hits it previously had on any one day in the past.
However, when the first column is red (a negative number), then you automatically know that this word is NOT at its all-time high. The percentage will tell you how far below it currently resides from its all-time high. For example, look up “Spell” and “Grocery.” They have roughly the same surge scale numbers but vastly different numbers in column 1. Spell is down roughly 50% from its all-time high, and Grocery is roughly 50% above its own high.
Thus, comparing the two words Spell and Grocery from just the first column could be misleading because it suggests that Grocery should actually be ahead of (or more important than) Spell. So when you combine the Surge Scale scores of these two, we would have to conclude that Spell’s one-day surge level significantly exceeds that of Grocery (to overcome the big difference in column 1) and thus Spell is higher on the list since it has a slightly higher Surge Score.
Big Picture Use of the Numbers
Therefore, we should first look at just the Surge Scores to determine what’s truly hot. The Red Alerts will be those that are at the very top of the chart with respect to Surge Scores, but not every run will have Red Alerts (as we’ve seen in the last week or so). So we first look at the top of the list for big Surge Scores. Then when we really need to analyze the predictive ability of any certain word, we can use the first column. Basically, where is this word in relation to its highest peak? Is it above it or below it? How far?
Keep in mind that negative numbers in column #1 don’t necessarily make it worthless. It is my contention that the biggest predictive words are those that are making the biggest moves. This includes the list of the Biggest Losers. For predictability in this model, we really want the percentages to be in the same direction. If the Surge Scale is negative, we want the biggest percentage DROP in column 1. Conversely, if the Surge Scale is positive, we want the biggest percentage GAIN in column 1. If the two numbers are mixed (like Spell, Weed, Dry, etc. in today’s run), then we don’t ignore it, but we simply acknowledge that this word isn’t at a high point and should be met with discretion.
We will also be using both numbers for historical data keeping. Hopefully, we’ll start seeing trends with certain Surge Scale numbers and the time it takes to manifest the word in a big headline. Or perhaps the trend will be associated with a cutoff amount. For example, maybe we’ll find out that nothing really comes true unless it has at least a 4.0 on the Surge Scale. This is just an example.
This new face of the DreamBot4 is exciting and proves to be much more robust than our methods of old.