Important: If you are not into scientific mumbo jumbo, please at least jump to the summary and implications, because while the supporting information is lengthy and cumbersome, the takeaways are very important indeed!
There were only 2 noteworthy correlation factors found in our Project August data. The first one was covered in Section 1, and it had to do with the prediction’s accuracy vs. how long until the prediction came true (it was negatively correlated).
There are a couple more correlations that we need to discuss. One is stronger than Section 1’s correlation and one is very low. Before we begin, we need to back up and start from the basics. It might surprise some readers that some of the Proj Aug headlines had more than one “hit.”
# of Hits per Prediction
In the runup to August 2014, as some of the predictions came true with striking accuracy, we were forced to consider that either the dream came true early (before the target month of August), or that dreams can have multiple, meaningful hits. Therefore, we hypothesized that some predictions can “come true” multiple times, which is a phenomenon that definitely happened.
Some of these examples would fall into the idea that the prediction was too vague, which then led to an inevitable overlap in meaningful hits. However, other situations arose where the prediction actually required multiple hits in order to come true. For example, Headline #101 predicted that “Nazi theme surges in world headlines.” In essence, the more headlines to support it, the higher the score. Incidentally, this particular headline had dozens of hits that were compiled into a couple of DreamBlog articles, but the spreadsheet only accounts for 2 hits (i.e., the two articles).
In Figure 2.1 below, column A is the number of hits that a headline received. Column B is the number of headlines that had that number of hits. For example, 61 headlines had just 1 hit, while 28 had 2 hits, and so on.
Figure 2.1: How many headlines (B) had how many hits (A)?
| A | B |
| 1 | 61 |
| 2 | 28 |
| 3 | 10 |
| 4 | 3 |
| 5+ | 1 |
Certainly, this cannot be an absolutely perfect chart, for not every single news article at state and municipal levels was scoured and exhaustively searched, and so this chart is more steering the audience to something much more profound.
Correlation between # of Hits and Final Score
The researchers found that a moderate level correlation exists between the number of hits and how high the final score would be. Those concepts are positively correlated at 0.525, meaning that when predictive headlines receive more hits, the higher the score tends to be.
This might be explained by the simple concept of comparing. When researchers looked for certain real-world headlines to match the predictions, they might have tended to ignore the headlines that were lower scoring and only accepted a higher score. It became somewhat of a subconscious stairstep approach, where psychologically, the researchers were not willing to accept an additional hit if the score was going to be less. At the same time, the researchers didn’t eliminate older hits, but rather superseded them with bigger or more accurate hits.
Although this is all leading up to something even more important, it is worth pondering the benefit of this interim junction. That is, DreamForecasters and precognitive dreamers should worry less about whether a hit should be called a hit, and instead simply grade each event as a discrete occurrence, worthy of its own score.
This has application to our standard ops here at the NDC, too. Let’s not quibble about whether it is or is not a hit. Instead, just grade the event and quibble over the score. The score is something that can be negotiated, but a “yes” vs “no” cannot be so easily reconciled.
The point: “Is it a hit?” is an irrelevant question. A much more appropriate question is: “What is the DreamSeer score?”
The Road to Important Dream Revelations
The reason all that previous discussion was important is because of this vital section here. There is one more correlation we need to discuss, but we first have to introduce the concepts of Dream Overlap, Congruency, Clarity, and Probability Quotient.
This could be one the most important outcomes from Project August. This section will end with a hypothesis that the more dream overlap and congruency we have, the more hits we’ll get and the higher the accuracy.
Dream Overlap
When dream content overlaps, we call that “dream overlap.” When we first began jotting down predictive headlines, we kept track of the characteristics surrounding this dream overlap (only for those predictions that were based on 2 or more dreams and/or linguistics). We noticed that sometimes the dream overlap was crystal clear in what the dreams were predicting. For those, we gave them a high “Clarity” score.
But sometimes, the dream overlaps were very vague, or you had to really work hard to see that overlap. For those, we labeled them having low “Congruency” (meaning that two or more dreams were similar, but the overlap was either confusing or not particularly compelling).
For every predictive headline, we assigned values to all these concepts: the number of overlaps, congruency of the overlap(s), clarity of the event or prediction, and whether there was linguistics support for the prediction. All this went into a pre-determined calculation of what we called, “Probability Quotient.”
“Probability Quotient” was nothing more than a scale used to determine overlap, congruency, and clarity and it assumed that the more overlap, clarity, and congruency would produce a higher likelihood of that prediction coming true. That was the hypothesis, and now let’s look at the data.
The Stats to Clarify
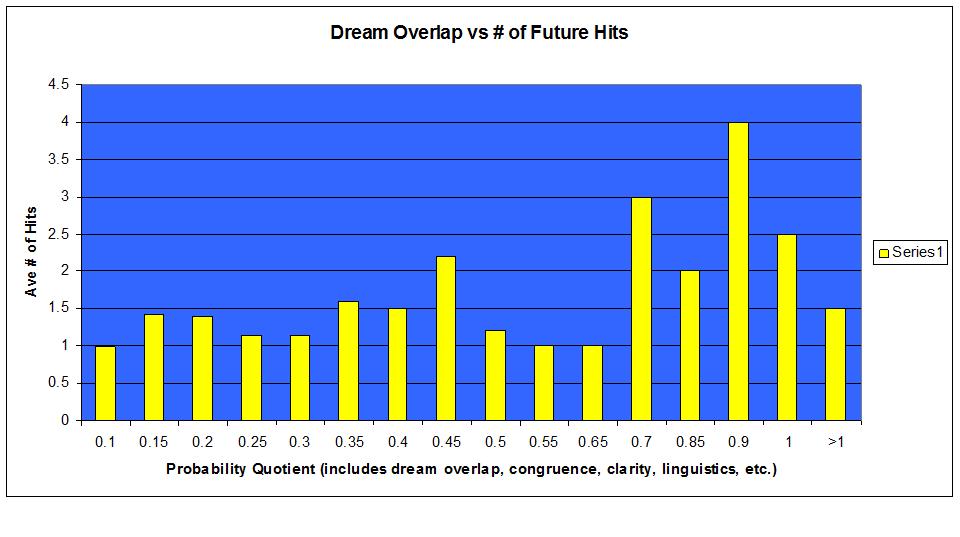
Now that we know about Dream Overlap and “Probability Quotient,” we proceed with some very interesting graphs and statistics. In Figure 2.2, we notice that Probability is indicated in the x-axis and on the y-axis, the average number of hits that the headline received.
In general, as the “Probability Quotient” increased (indicating more overlap, higher clarity, more congruency, etc.), the headline achieved a higher hit rate (meaning that there were multiple real-world events that resembled the prediction). By itself, this isn’t so magnificent per se, but there is big impact when we return to the previous section on the correlation between # of hits and final score. Basically, Figure 2.2 is inferring what we will see in Figure 2.3. That is, the higher the Probability Quotient, the more accurate the prediction.
Figure 2.2
Before we move onto the bigger stats here, notice how there tends to be a diminishing return after the quotient reaches greater than 1.0. This might be explained by “day residue.”
The few predictions that had “Probability Quotients” over the 1.0 mark could be considered more common events, objects, or locations. Day residue indicates dream material that is based on past events, and can obscure the DreamForecaster’s vision of the future. Perhaps a “Probability Quotient” that is too high (i.e., above 1.0) might be indicative of day residue and perhaps should be scrapped or at least investigated further.
Also, there is indeed a correlation (albeit very low) between our calculated “Probability Quotient” and the number of hits the prediction will receive. With over 168 entries in the data pool, the statistics show a low, positive correlation of 0.247, meaning that as the “Probability Quotient” increases, the # of hits to that prediction also increases slightly.
In laymen’s terms, the more the dreams overlap, there is a slightly higher chance that there will be more hits occurring for that prediction. Even more important is the next graph, which indicates that the more the dreams overlap, the more accurate a prediction will be, statistically.
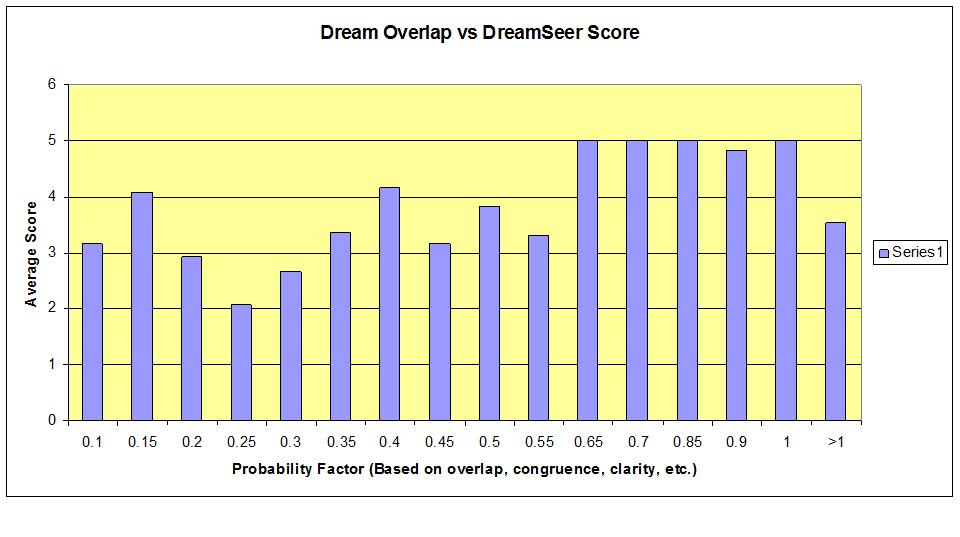
Notice Figure 2.3 below. Just as in the last graph, the “Probability Quotient” is on the x-axis, but now the accuracy (i.e., average DreamSeer score) is indicated on the y-axis. Interestingly, we see a wave in the data until 0.65 Probability Quotient. We have max scores (or near-max scores) between that and a Quotient of 1.0. Then, the accuracy drops off, just like the # of hits did in Figure 2.2.
Figure 2.3
Summary and Implications
– As the # of real-world “hits” to the predicted headline increases, the Accuracy (or DreamSeer score) increases with a moderate level of correlation. In laymen’s terms, the prediction will end up getting a higher score if the prediction receives more real-world hits.
– As the level of overlap increases in the dreams and/or linguistics AND there is more clarity and congruency in the overlap, the higher number of hits are likely and thus the higher level of accuracy is probable. In laymen’s terms, when making a prediction based on dream material, you want the material that overlaps from dream to dream, and you want the overlap to be clear and congruent. If you use this rule, statistically, you’ll end up with a higher accuracy when the prediction comes true.
– The implications of all this is quite simple and relevant. Unless we’re dealing with a talented and honed individual dreamer (with proven, validated precognition), it is best to stick with dream overlaps that have good clarity and high congruency. It is also very important to include linguistics overlaps as well. When the linguistics show clarity and are congruent with the dream(s), this is a very good indication of more future hits and a higher accuracy when the hits do manifest in real life.
---------- NDC Announcments -----------
Don’t miss our daily DreamBot run which shows a brief status of the collective unconscious.
Copyright © 2014 Chris McCleary. Except for quotes, all rights reserved and any reference about this material requires a link back to this page.


I love that picture!
I do not agree with this statement:
The point: “Is it a hit?” is an irrelevant question. A much more appropriate question is: “What is the DreamSeer score?”
For one reason, if you remember Sky Flash, we were all looking for sky flashes, and I still have not seen any news that would compare to what I saw in my dream. It may have been a hit for the NDC, but for me personally, I wouldn’t call it a hit. 🙂
Argument doesn’t add up, NADW. You’re a fantastic and talented human & dreamer, but not a very talented logician. We got lots of high-scoring hits for NDC headlines on Sky Flash. Did you notice I used both words…(hit and score…smiles).
As for your non-hit, the argument still stands. If you’re stuck in “hit” as the only relevant word, then you’ll remain hitless. But if go to scoring, I bet you can find some low scoring “hits.”
Is that better, or not? 🙂